The 2025 Kamchatka earthquake was a monster. When the seafloor ruptured off the coast of the Russian Far East, the immediate concern wasn't just the shaking. It was the water. Traditional buoy-based warning systems are good, but they're sparse. They're like trying to track a break-in with a single motion sensor in the hallway while the burglars are already in the kitchen.
We’ve relied on the Deep-ocean Assessment and Reporting of Tsunamis (DART) system for decades. It works by measuring pressure changes on the ocean floor. But if a wave doesn't pass directly over a buoy, we’re basically guessing. That’s where the Surface Water and Ocean Topography (SWOT) satellite stepped in during the Kamchatka event, and frankly, what it found makes our current tech look like a dial-up modem in a fiber-optic world.
The Ghost Wave Nobody Saw Coming
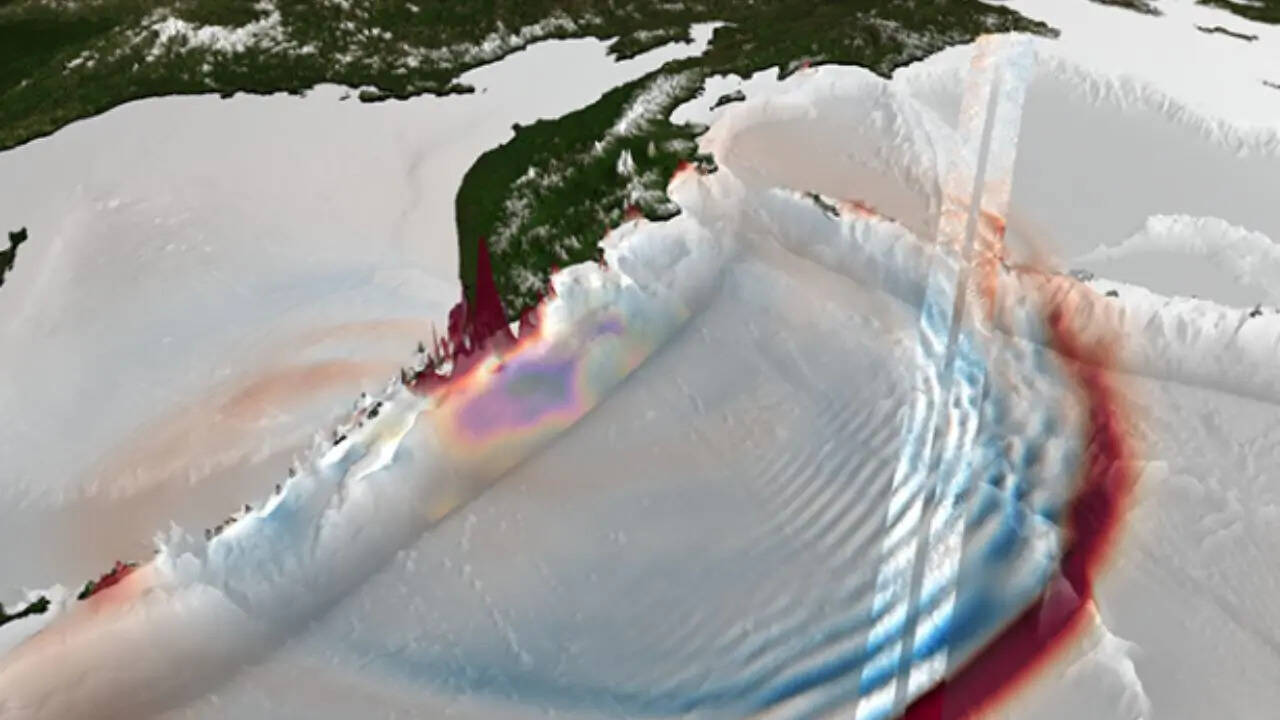
During the initial minutes following the Kamchatka quake, coastal sensors showed a predictable rise in water levels. Standard models predicted a significant but manageable surge. However, SWOT was passing overhead at the exact right moment. This satellite doesn't just look at dots; it maps the entire surface of the water using wide-swath interferometry.
It caught a "ghost wave." This was a secondary pulse of energy moving at a slightly different angle than the primary swell. Because of the complex bathymetry—the underwater mountains and valleys—of the North Pacific, this hidden signal was being amplified in ways a single-point buoy could never detect. SWOT saw a 10-centimeter rise across a 50-mile wide front that was completely invisible to ground-based radar.
Ten centimeters doesn't sound like much. But in the open ocean, that's a massive amount of displaced energy. When that "small" bump hits shallow water, it stacks up. It becomes a wall. If we hadn't seen that signal, the surge at the Aleutian Islands would have caught everyone off guard.
Why Wide Swath Radar is a Total Necessity
The magic of SWOT lies in its Ka-band Radar Interferometer (KaRIn). Most satellites before this were like looking through a straw. They measured a thin line directly beneath them. If the tsunami wave was five miles to the left, the satellite missed it.
SWOT covers a 120-kilometer (75-mile) swath. It provides a high-definition 2D map of the ocean surface height. During the Kamchatka event, researchers from NASA and CNES (the French space agency) realized that SWOT could resolve features as small as 15 kilometers. This allowed scientists to see the "texture" of the tsunami.
Most people think of a tsunami as a single big wave. It isn't. It's a series of ripples, and the Kamchatka data proved that these ripples interfere with each other. Sometimes they cancel out. Sometimes they combine to create a "rogue" tsunami wave. SWOT captured this interference pattern in real-time, providing the first-ever visual proof of how these waves evolve over deep water.
The Problem With Our Old Models
- Buoy Gap: There are only about 60 DART buoys globally. The ocean is 139 million square miles. Do the math.
- Coastal Noise: Near the shore, tide gauges get "noisy" because of local waves and wind. It's hard to isolate the tsunami signal.
- Latency: By the time a wave hits a buoy near the coast, it might be too late for a nuanced evacuation.
Turning Data Into Minutes of Life
Minutes matter. In 2026, we're finally seeing the integration of SWOT data into the Pacific Tsunami Warning Center’s workflow. The Kamchatka earthquake served as the ultimate proof of concept. By identifying the hidden energy pulse, analysts could refine the "threat zone" with surgical precision.
Instead of telling an entire coastline to flee to high ground—which causes traffic jams, accidents, and economic chaos—authorities could pinpoint which specific harbors were at risk of resonance. Resonance is the real killer. It's when the incoming wave frequency matches the natural "sloshing" frequency of a bay. It turns a two-foot rise into a ten-foot surge.
SWOT’s ability to map the sea surface height (SSH) to within a few centimeters allows us to predict this resonance before the water even hits the continental shelf. We aren't just reacting anymore. We're simulating the impact based on live, orbital data.
The Infrastructure Struggle
Don't think this is a perfect fix yet. The big hurdle isn't the satellite; it's the downlink. SWOT generates a terrifying amount of data—about 20 terabytes a day. Processing that fast enough to issue a warning is a massive computational challenge.
During the 2025 event, it took a bit too long to get the "clean" version of the data to the people who needed it. We’re currently seeing a push for better onboard processing so the satellite can flag anomalies itself rather than sending raw noise back to Earth.
If you live in a coastal area, you should be looking at how your local emergency management team uses "integrated" warning systems. If they're still just waiting for a buoy to go off, they're behind the curve. The future is orbital.
The Kamchatka earthquake wasn't just a disaster. It was a wake-up call that the ocean is much more complex than our 20th-century sensors suggested. We have the eyes in the sky now. We just need to make sure we're actually looking at what they’re showing us.
Check your local evacuation maps today. Those maps are being redrawn right now because of what SWOT found. Don't assume the "safe zone" from five years ago is still the safe zone today.